The data we gathered from our web scraping is pretty straightforward and simple so we won’t have to do much in SQL here overall.
However, we do have a second table that has information about each city’s distance from the beach that is important, so we’ll have to join that onto the table we created and gave a preliminary clean in Python.
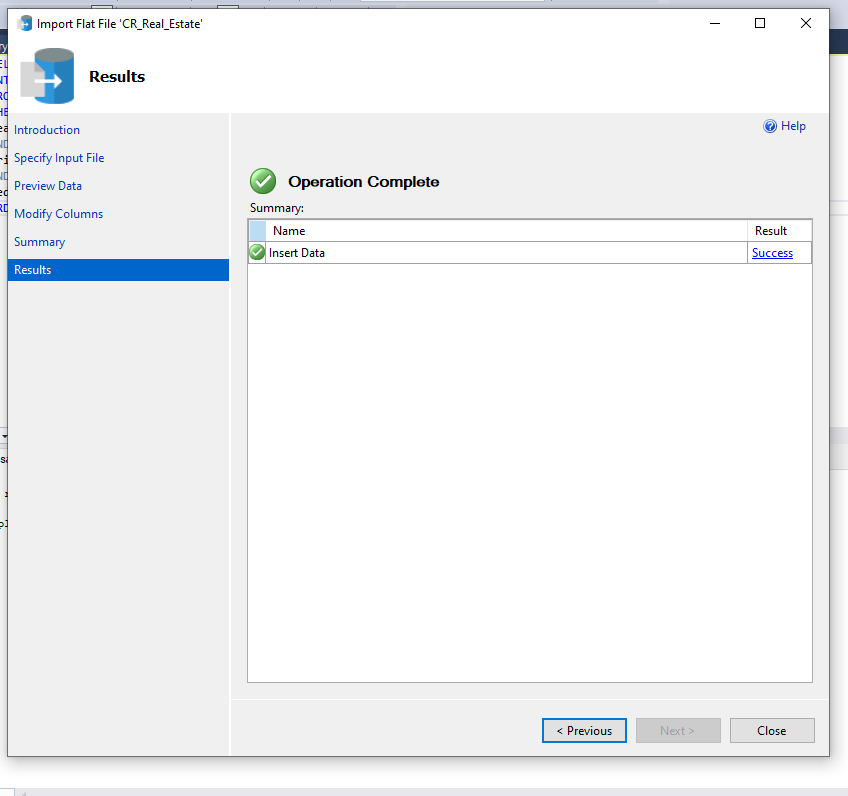
I’ve been using Microsoft SQL Management Studio but also dipping my toes in other services such as PostgreSQL and MuSQL. I like that they are open source, but for now I’m leveraging the convenience of staying within the Microsoft ecosystem. I’ve got SSMS running so we’ll start by loading our data onto the SSMS server from the .csv we created previously as dbo.all_homes.
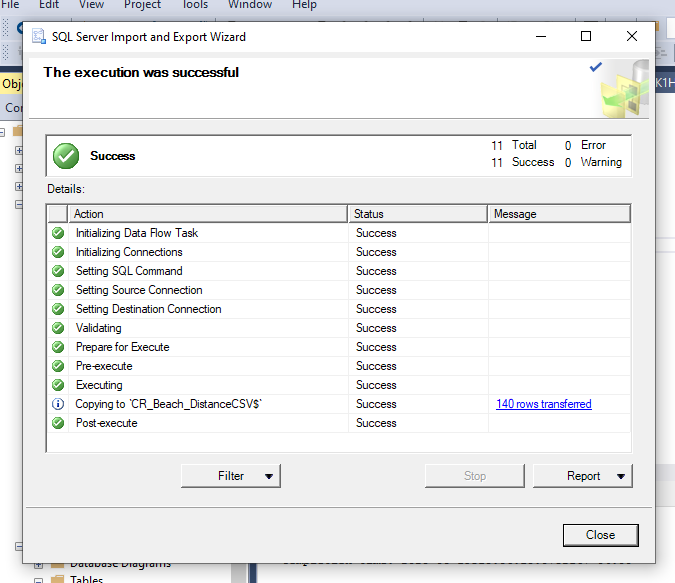
Next we’ll import our data on the distance from each city to the beach as dbo.Distance. To create this table I used ArcGIS, which made the process quick and smooth. During my junior year, when I decided to focus on Data Analysis, I took a few remote sensing electives to really develop my ability to do geo-spatial analysis. While the physics could be intense, I gained a lot of valuable skills.
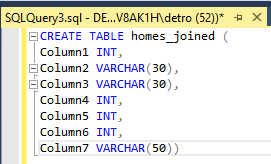
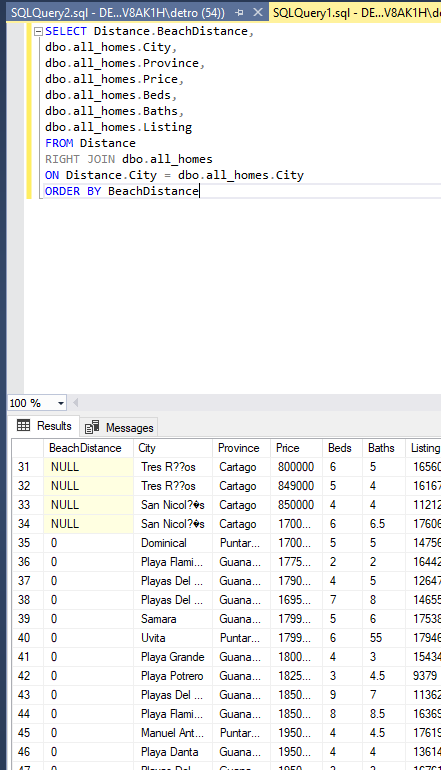
Next we’ll join our two tables into a new table we call dbo.homes_joined.
I ordered the query by BeachDistance, because when I was doing some preliminary analysis on the data I noticed we had some issues with accent symbols that I thought might produce some errors that were clustered at the lower range of the BeachDistance.
While taking a look at the heads and tails of the data columns to make sure everything looked good I noticed some errors regarding bathroom size - 55 and 65 bathrooms seems like a lot.
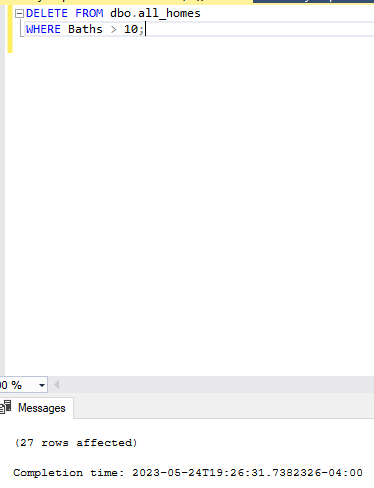
I took a look at the actual listings on the website we scraped our data from using the ListingID - they were site errors, unless a 5 bedroom house also has 55 baths. I’d assume it was a typing error, and it was likely 5.5 baths, but without being sure it was safer to just drop it with the other errors.
Even on the slight chance some of these aren’t errors, I’m not looking to buy a mansion, so for the purpose of the report, it’s not much of a loss.
I thought I’d take a second to talk about cleaning.
I believe it’s important to do multiple cleaning passes to maintain data integrity, operations can introduce new errors and it’s always possible to miss something along the way. By doing a quick exploration between major steps, it’s easy to remove these errors. It’s very little additional effort for a lot more confident data.
We deleted the nulls, nothing particularly hard. The dataset we scraped is no more complicated than it needs to be with a lot of the prep work already done in Python using pandas, which is a fantastic library I use almost daily.
SQL is great, especially when you’re dealing with big institutional data - trying to find a bunch of needles in a haystack, or setting up downstream databases, like departmental data-marts from company wide data-warehouses or the like. It’s often the right tool for the right job, but I’ll always appreciate how flexible Python is.
(Ignore the IntelliSense errors, I just hadn’t updated it in a minute)
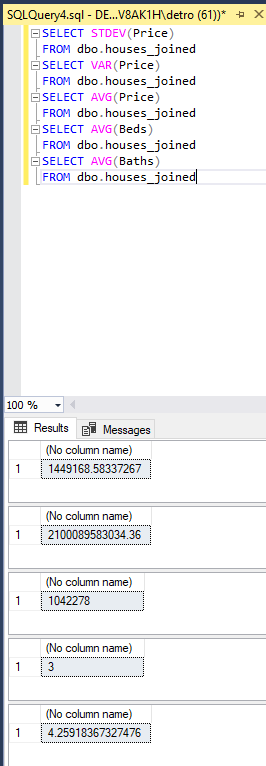
Before taking the data, now joined, thoroughly cleaned by multiple passes and formatted properly I decided to do a little SQL query just to grab some insights on our data as we move into Power BI.
What’s most notable is the extreme standard deviation and variance we have with our dataset. This speaks to a real issue in Costa Rica and the impetus of building this dataset and report.
Costa Rica lacks public sales information on real estate, meaning there is no Comparatives Data like in the US or many other countries. Because of this, sales prices are not based on general trends like neighborhood and number of bedrooms, etc. . . prices are wild and chaotic, with every seller basically guessing at what they can get; which is almost always more rooted in dreams than market value. It’s not unheard of to negotiate down 20% or more on a sales prices.
This creates a fundamental limitation to our model - we don’t actually have any way to determine relative value, only relative asking price. We’re hunting for deals though, so we can at least use this data to find those homes that stand out in terms of affordability and given the utter chaos of the housing market, any insights we can gain will be invaluable.
Additionally, Costa Rica also has a wide discrepancy in terms of housing. Locals typically live in smaller, modest homes while rich expats build mutli-million dollar mansions next door. It’s not surprising to see this incredible range, and is something we should keep in mind going forward.
We’re now moving into Power BI, you can find a link to the report here.
The first page I’ve set up is the Navigation Map, which allows us to at a glance see the number of listings (bubble size) and average price per city (color) compared to national average.
I won’t go into too much detail, since if you’ve followed the link it’s pretty self explanatory. I’ll note however a few key features:
The Price Slicer: This slicer allows you to set a price range, all corresponding information will update in real time across the entire report to match the range.
The Skew/Price Window: If a selection is made regarding a City or Province, this window will give the average price and the median price (as our target line). This lets us, at a glance, see if we have a median price below the mean, indicating a Left Skew, which means we should have generally lower prices to explore. If a listing is selected from the table, it will display the listing price only.
Key Takeaways:
Pickings are slim at affordable price points. There are only 93 listings for under $200,000 and 1104 for over $200,000.
While our number of choices are fairly limited, we have a wide variety of locations to choose from, all clustered on the east coast, with a large number on the Nicoya Peninsula - we should keep a look out in this city.
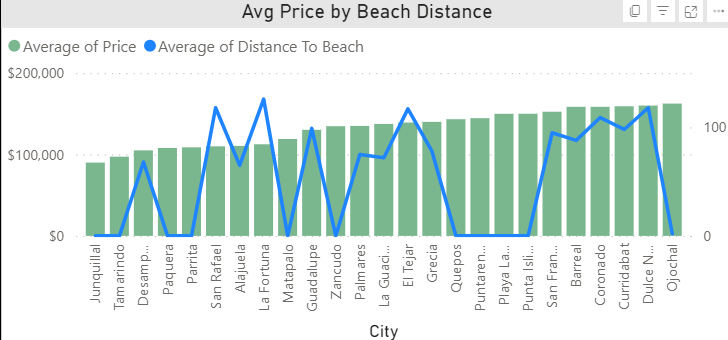
Going inland doesn’t coherantly reduce asking price, though it should. This is a good example of Costa Rica’s unmoored asking prices. While there are other factors at play like number of bedrooms and baths, these show high variance as well. The Beach Premium is real, but sellers don’t seem to have much respect for it.
Here we can see on the bed//bath chart a nice looking ratio - 3 beds, 3 baths, at an affordable $135,000 price point - which highlights on our other charts showing us the city, relative price, and number of other listings in those cities. We’ll drill-through to the map page, to see them on our table so we can grab their Listing ID’s
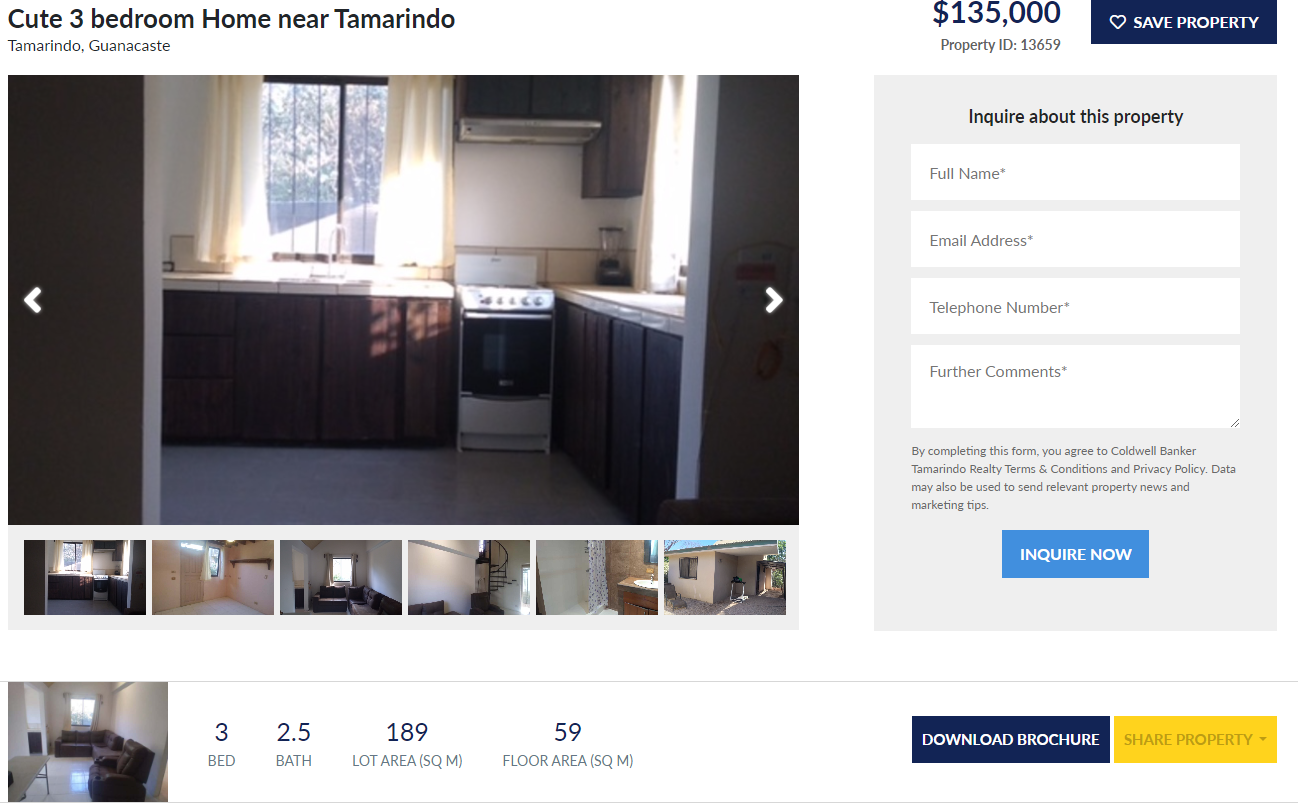
‘m interested in the Tamarindo one, it’s an easy walk to a popular beach. All I had to do was punch in the Listing ID into the site, and here we go - a cute little fixer-upper right by the beach!
That’s it (for now)! We took this project all the way from writing our custom web scraper in Python, to loading it onto our server database, querying what we needed with SQL and finally building out a report in Power BI to analyze that data and gain some useful insights on investing in a beach town Airbnb rental Costa Rica.
Now, I’m one step closer to my dream of vacations laying in the warm sand. What would also be a huge step would be an interview or job offer! Feel free to reach out to me at any of the contact links on my main page, and hey, maybe eventually you’ll know someone who has a beach house in Costa Rica and owes you one!
From the Navigation Map Page you can drill-through to the Insights Panel on either the Province or City level. This page can also be reset from the button to view National trends. You can also drill through to the Map Page from all of the data here, and reset to national from the Map Page reset button.
Here we have the following charts:
[top/left].Bed//Bath Clusters - this chart shows us the relationship between average number of beds and bathrooms in regard to price. On a more granular, drilled down view, we can see variations in pricing trends between cities/provinces. This is useful for finding house with a relatively high bed and bath number for the area.
[top/right].Listings//Price - this gives us the quantity of listings per city (bars) with a trend line of price super imposed - as you scroll left, price will increase. This is useful to find cities with a high number of listings at a relatively low price.
[bottom/left].BeachDistance//Price - here we can look through the average price of homes by distance to the beach (from their respective city center). Proximity to a beach fetches a premium, so here we can see whether that premium is in effect.
[bottom//right].Price//Beach Distance Clusters - this graph gives us insights into the relationship between that beach premium and price - and potentially spot outliers in either direction.
However, there’s a fair number of affordable houses that are close to the beach, which is key for a rental property (clustering on Y axis).
Beach towns tend to skew to the right, with higher prices - but there are a few areas where the price skews left, meaning some unusually cheap houses. We should definitely keep an eye on these towns, like Tamarindo, as well.
Within our price range among beach towns, we have a few different clusters of bed//baths - the largest being 3 bedrooms with 2-3 bathrooms. If we see prices towards the lower end with this bed and bath profile, it’s worth taking a look at the listing.
These look pretty good, both are very nice towns either known for their tourism or very close to major tourist actions, like Manuel Antonio National Park which has the best beach I’ve ever seen (you can see an image in the first part of this project where we do web scraping).
